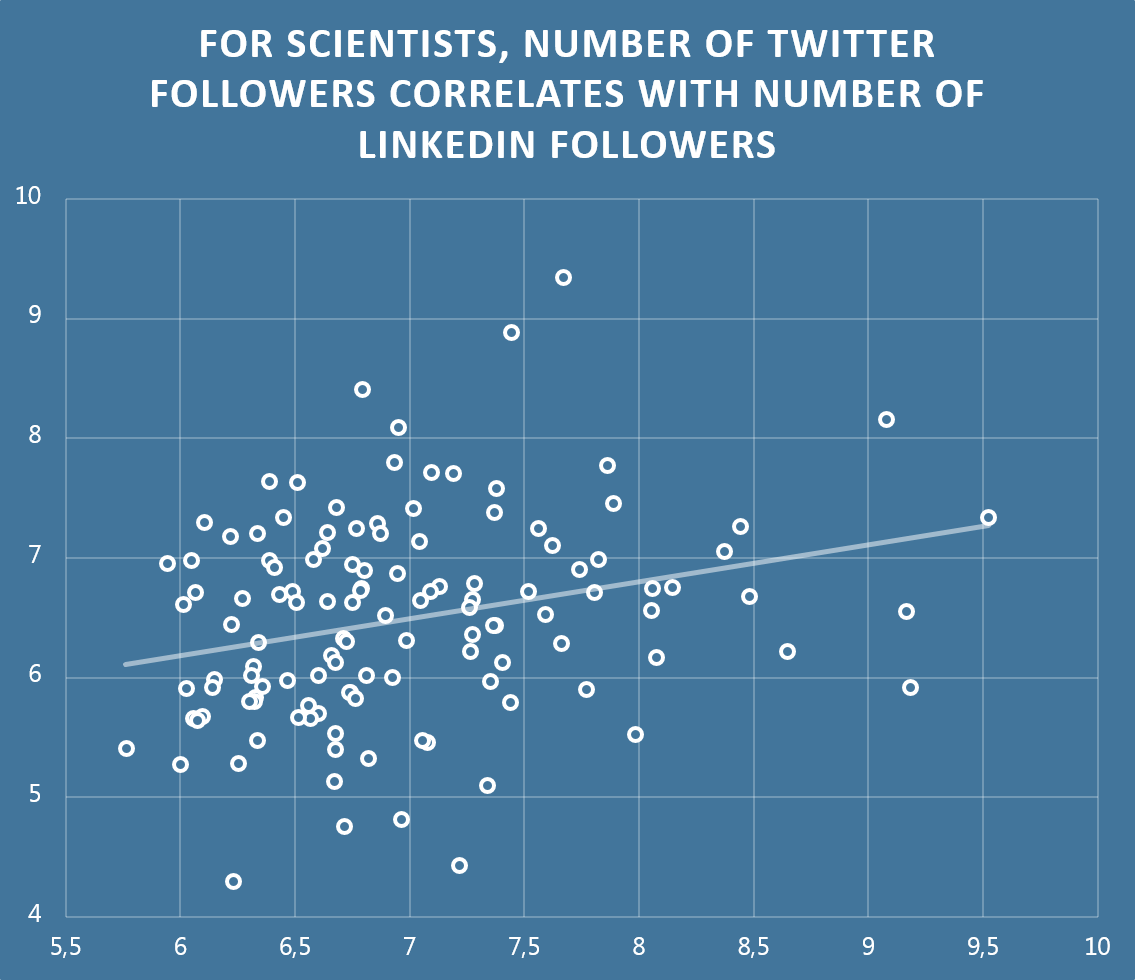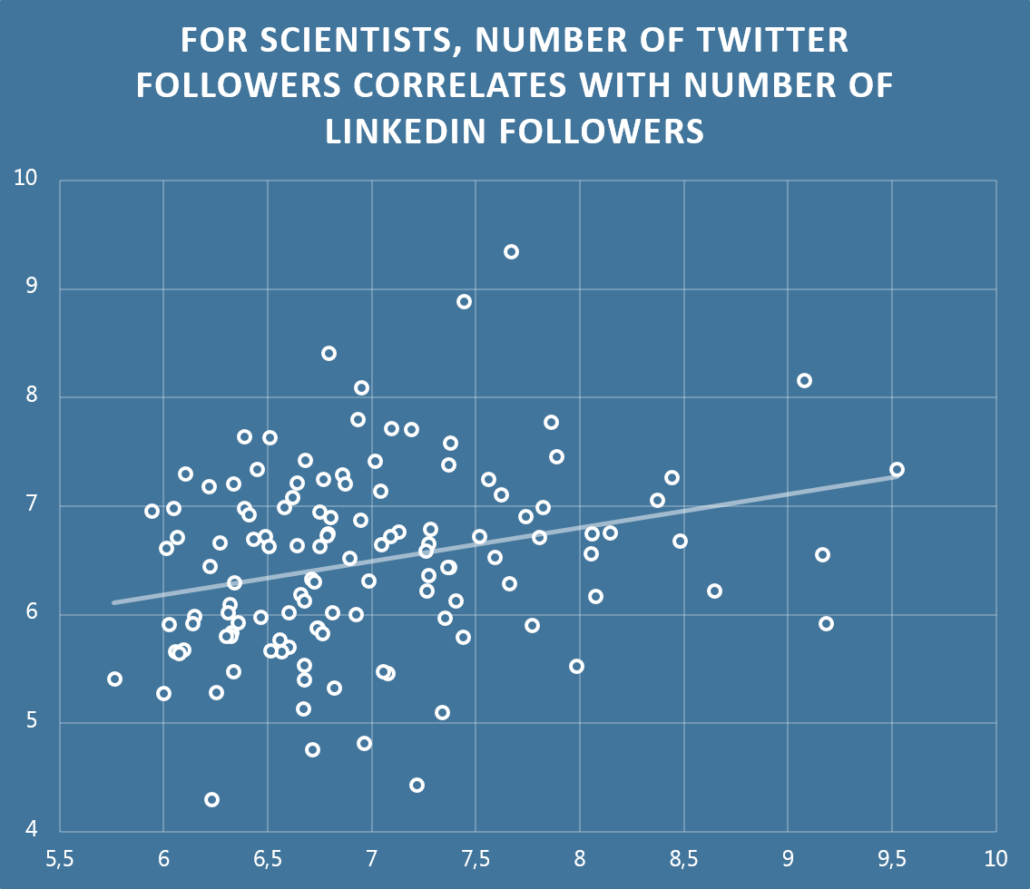
Each scientist is represented by a dot. On the x-axis is the log of their number of Twitter followers. On the y-axis is the log of their number of LinkedIn followers
Each scientist is represented by a dot. On the x-axis is the log of their number of Twitter followers. On the y-axis is the log of their number of LinkedIn followers